


A.J. Merlino is a five-time GRAMMY-nominated music educator with a passion for cultivating creativity and innovation in higher education. His background in the arts as a performer and large-scale project manager helps inform decisions as a business strategist, bringing a unique perspective to the educational landscape. As a touring musician and clinician, he has presented in Scotland, Croatia, Greece, Thailand, Canada, Australia, and Argentina. Dr. Merlino has worked as a project manager, music director, composer, and performer for many projects held at The Venetian, Mandalay Bay, MGM Grand, and Cosmopolitan in Las Vegas. Dr. Merlino’s experience collaborating with campus leadership and community partners has successfully increased students’ educational programming and learning opportunities while positively impacting student enrollment, matriculation, retention, and outcomes through career-level engagement.
In my previous article, “Using Project Management Principles to Develop Academic Learning Communities,” I discussed how academic learning communities could be formed and developed using project management principles. In this follow-up article, I will use Ishikawa diagrams to identify the root cause of common problems in higher education and provide steps for your project team to address these issues. An Ishikawa diagram, also known as a fishbone diagram or cause-and-effect diagram, is a visual tool used to identify and analyze the root causes of a problem or issue. It is named after its creator, Kaoru Ishikawa, who developed the diagram in the 1960s as a quality control tool.
Although typically used in quality control and problem-solving, Ishikawa diagrams can be used in various fields to identify potential risks and challenges. For example, in higher education, Ishikawa diagrams can identify and address student retention, postgraduate outcomes, program development, and curriculum design issues. By understanding the root causes, you can develop strategies to prevent problems from happening in the future. Additionally, these diagrams can help identify potential barriers to effective teaching and learning or identify gaps in knowledge or skills that may hinder the success of a project. Some focus areas might include:
- Lack of student engagement
- Inadequate faculty support
- Insufficient resources
- Low student enrollment
Identifying the root cause of a problem with Ishikawa diagrams:
- Develop a problem statement: The first step in using an Ishikawa diagram is identifying the most significant issue that needs addressing. This could be anything from low student retention rates to ineffective teaching methods. The goal of this step is to focus on and identify the effect rather than the associated causes. This problem statement is later placed at the “mouth” of the Ishikawa diagram.
- Gathering data: Once the problem statement has been identified, the next step is to collect as much data as possible related to the problem. This could include student performance data, first destination surveys, feedback from students and faculty, or academic literature pertaining to the issue.
- Identify major categories: Identify the major categories that may contribute to the problem statement using the data collected. These are typically the “bones” of the fishbone diagram and are larger ideas than specific causes. Categories may include people, processes, policies, or the environment.
- Identify underlying causes: Within each major category, brainstorm possible causes that may contribute to the problem. These are the “branches” of the fishbone diagram. Be as specific as possible and use your team’s expertise and experience to generate a comprehensive list of potential causes. Every idea should be captured in this step and can be refined or removed later. Causes may fall into multiple categories, take the form of events, or mistakes, and may be interrelated.
- Creating the diagram: The Ishikawa diagram can be created using the data gathered in the previous steps. Place the problem statement at the “mouth” of the fishbone, and add your categories, such as people, processes, policies, and environment, to the ends of each “bone.” Once you have organized the categories, insert the causes related to each category as “branches.”
- Analyze and prioritize causes: Once your causes are entered in the diagram, analyze, connect, and prioritize them. Consider which causes are most likely to contribute to the problem and which are easiest to address. There are many techniques like 5-Whys, Pareto analysis or a decision matrix to help with this step. To Use 5-Whys, start by clearly defining the problem, then ask “Why?” to identify the immediate cause, often tied to a process failure. Ask “Why?” again about this cause, and repeat until a root cause is identified, typically after five rounds. The key benefit of this method is it emphasizes understanding root causes over treating symptoms, leading to more effective, long-term solutions. Describing the use of all these tools is beyond this article’s scope, but many resources are available via the Project Management Institute.
- Test and validate causes: After prioritizing and connecting the potential causes, test and validate them to confirm they may contribute to the problem. You should use the previous data as part of this step, but drill down and connect reports when applicable. Draw correlations to data points when appropriate and provide evidence to support your findings. In this phase, a lack of evidence is as significant as an abundance of evidence, as the former will reveal anecdotal correlations to the problem rather than fact-based connections.
- Refine the diagram: Once the analysis is complete and evidence is presented, remove items that do not show fact-based connections to the problem. This analysis can be used to develop solutions to address the problem, allocate resources to effectively address the issue, and select/refine the appropriate project team.
- Developing solutions: Based on the analysis of the diagram, a project plan (timeline, scope, deliverables, budget, etc.) can be developed to provide a solution to the root cause of the problem. The solution can be tested and refined until the problem has been adequately addressed, and the project team’s needs can be altered concurrently with this development. If there are multiple root causes, you may use an iterative problem-solving approach. Each iteration of this process should address a root cause, improving a category until they no longer include an issue, consequently solving the problem.
- Monitor and measure results: After implementing your plan through each iteration, monitor and measure the results to ensure that the root cause has been effectively addressed, and the problem does not recur.
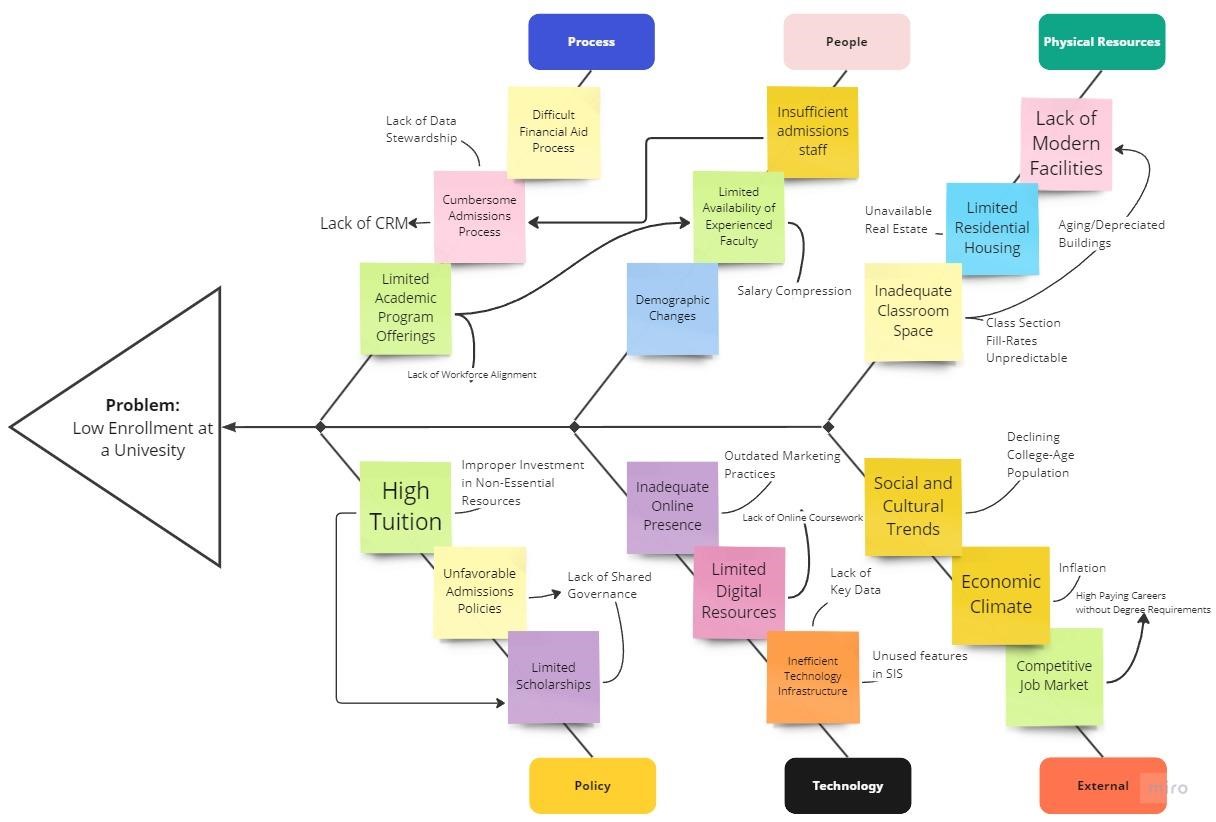
This example uses low enrollment as the problem to be addressed:
Examples of Using Ishikawa Diagrams in Higher Education:
- Curriculum Design: Ishikawa diagrams can be used to identify the root causes of issues related to curriculum design. For example, suppose students are consistently struggling with a particular course. In that case, an Ishikawa diagram can be used to identify potential causes such as ineffective teaching methods, unclear learning objectives, or outdated course materials.
- Student Retention: Ishikawa diagrams can also be used to address issues related to student retention. For example, suppose a significant number of students withdraw from a particular program. In that case, an Ishikawa diagram can be used to identify potential causes such as inadequate academic support, poor program fit, or high program costs.
- Program Development: Ishikawa diagrams can be used to identify the root causes of issues related to program development. For example, suppose a new program needs to attract additional students. In that case, an Ishikawa diagram can be used to identify potential causes such as poor marketing strategies, lack of student interest, or insufficient program funding.
Limitations of Ishikawa Diagrams
Ishikawa diagrams are a valuable tool but have some limitations. One limitation is that they can be time-consuming to create and difficult to use if the problem is complex. Therefore, Ishikawa diagrams should be used as A tool to solve a problem, not THE tool.
Additional tips for using Ishikawa diagrams in project management:
- Involve all project stakeholders in the development of an Ishikawa diagram, not just decision-makers. In the context of higher education, this may include students or parents. The collaboration will help to ensure that all potential causes of problems are identified.
- Be specific and connect causes when creating the Ishikawa diagram. The more specific you are, the easier it will be to develop an effective project team and plan. If specificity becomes difficult, use 5-Whys to aid in this process.
- Review the Ishikawa diagram regularly and update it as needed. This is an iterative document; regular updates ensure the diagram is accurate and useful. Beyond identifying root causes, this tool is useful in identifying positive behaviors that may be transformational in other functional areas within an institution.
Ishikawa diagrams are useful for project managers in higher education. They can be used to identify the root causes of issues related to curriculum design, student retention, and program development, among others. Further, this tool can help to identify potential risks and challenges, develop mitigation strategies, improve communication and collaboration, and make better decisions. By using Ishikawa diagrams to analyze and address these issues, higher education institutions can improve student outcomes, enhance program effectiveness, and better meet the needs of their students and faculty.